

Intro
For those of you unfamiliar, we have a Mock Draft Simulator here at Prospects Live. With it you can build you own mock draft making all the selections, or select for any number of teams and let the simulator do the rest, or just run a draft simulation without any input.

Naturally, I'm curious at the accuracy of the simulations. Shortly after the release of the tool I built code to simulate a mock draft independent of the tool itself. It allowed me to summarize a large sample of mock simulations and see how the different settings changed the percentages of different players getting drafted at different spots. At the time, Seth Hernandez was getting a lot of buzz around the #1 pick. Here is an example of what his percentages looked like at the time with the "Normal" simulator aggression setting over 1000 simulations:
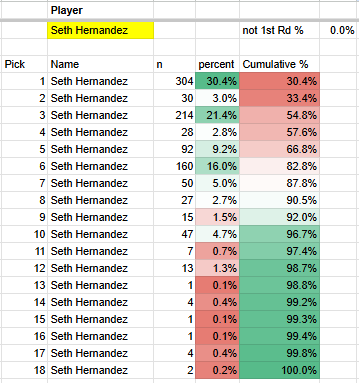
As you can see from that table, the simulator doesn't just throw our draft rankings into a randomizer and call it a day. Each pick considers our rankings, but also takes inputs on the likelihood of taking a prep or college player, a hitter or pitcher, along with a trio of ranked targets. Those elements are all combined together to create a probability that a player is selected at a given pick based on who is remaining at that point in the draft.
Based on our early season rankings, demographic likelihoods, and targets, here's what the first 10 picks looked like:
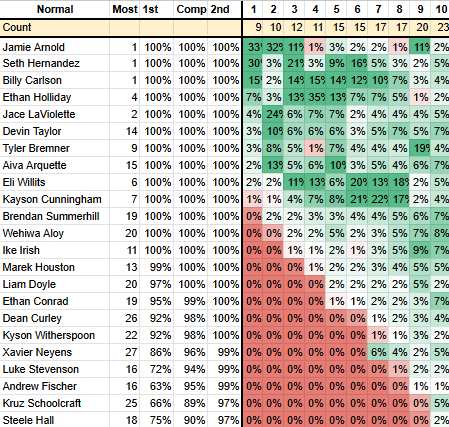
The table is sorted by probability of being taken 1st overall. The "Most" column shows the spot the player was simulated in the most often. As you can see, the simulator was far from stuck on any player at a given spot. The highest probability in the table above was Ethan Holliday at 4th overall to the Rockies 35% of the time.
Our "Normal" aggression setting considered 9 players for the 1st overall pick then slowly increased the pool of players to consider.
How Close Can We Get Over 5000 Simulations to a Perfect Draft?
The Simulation Settings
With the latest draft ranking and mock solidified, I set the settings for the simulation.
Simulator Aggression Setting: Aggressive
Simulations: 5,000
I wanted to have best possible chance at a diverse set of drafts in order to strike it big. On the flip side, I'm limiting the amount of "chalk" starts to build off of. Basically, I'm leaning into the fact that much of where the draft is headed is unknown. The aggressive setting considers 11 different players to start for the first pick and weighs hitter/pitcher, prep/college probabilities and targets more than our final draft rankings.
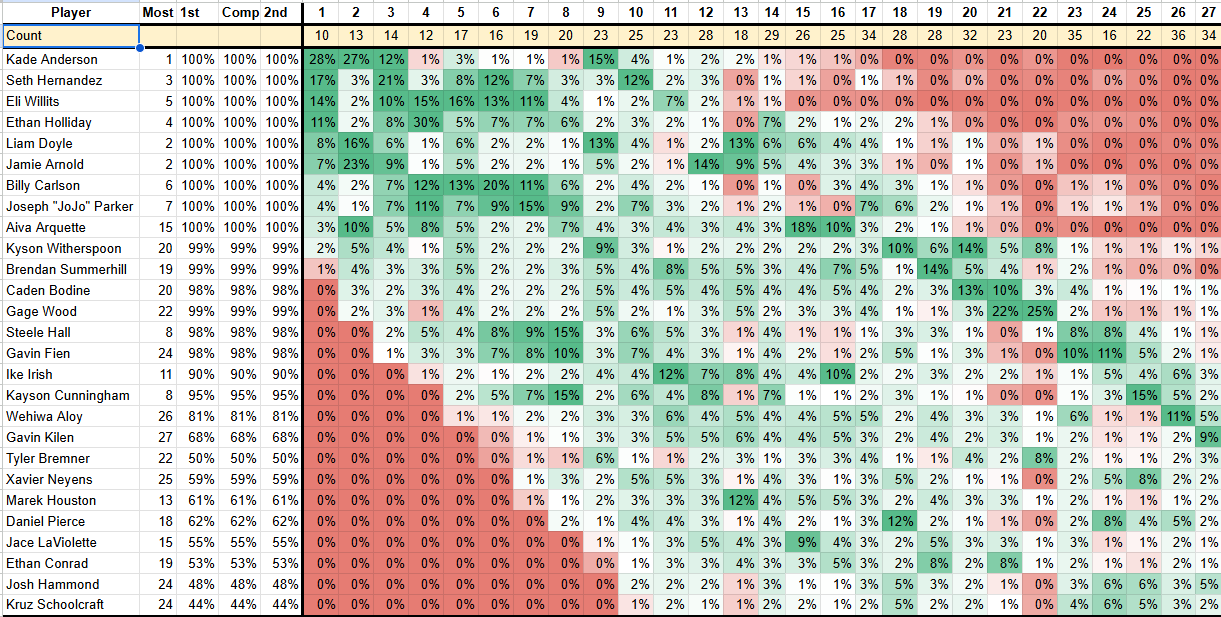
The Probabilities Table
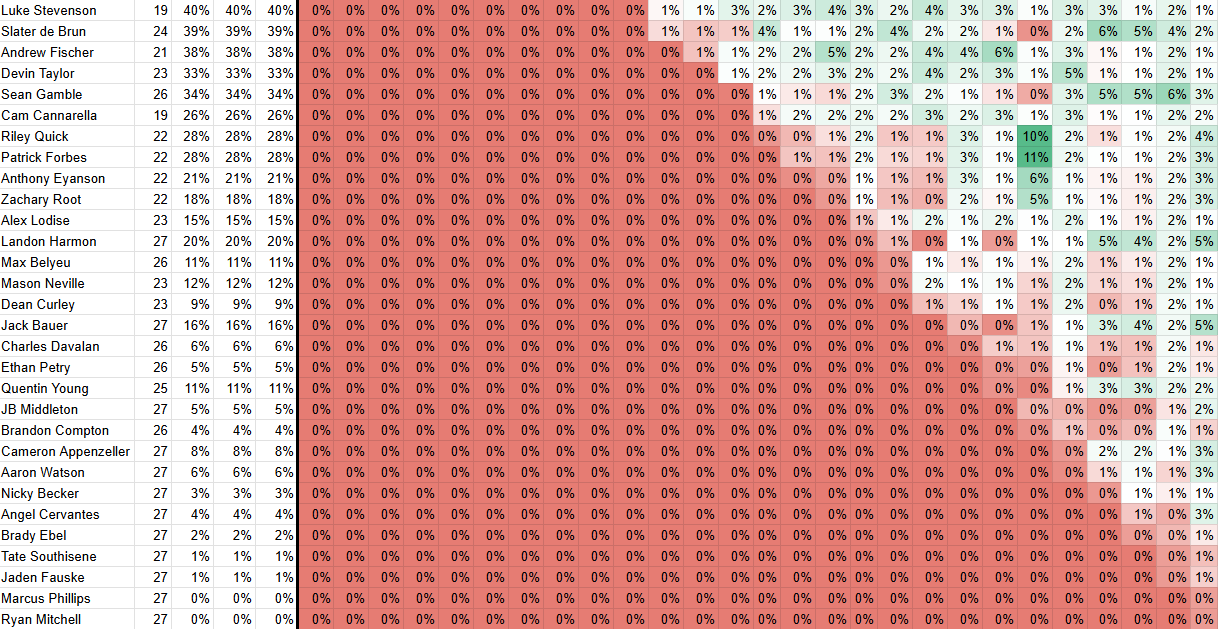
Just like the table displaying the probabilities for the first 10 picks above, we have a table of the final simulator probabilities for the entire first round below. We've got 57 names considered across the 27 spots. If I had to critique this a bit, I don't love how far Jamie Arnold and Aiva Arquette fall in such a high percentage of the drafts. However, with 5,000 simulations, we still have a lot of scenarios with the projected early 1st round players going in the top spots.
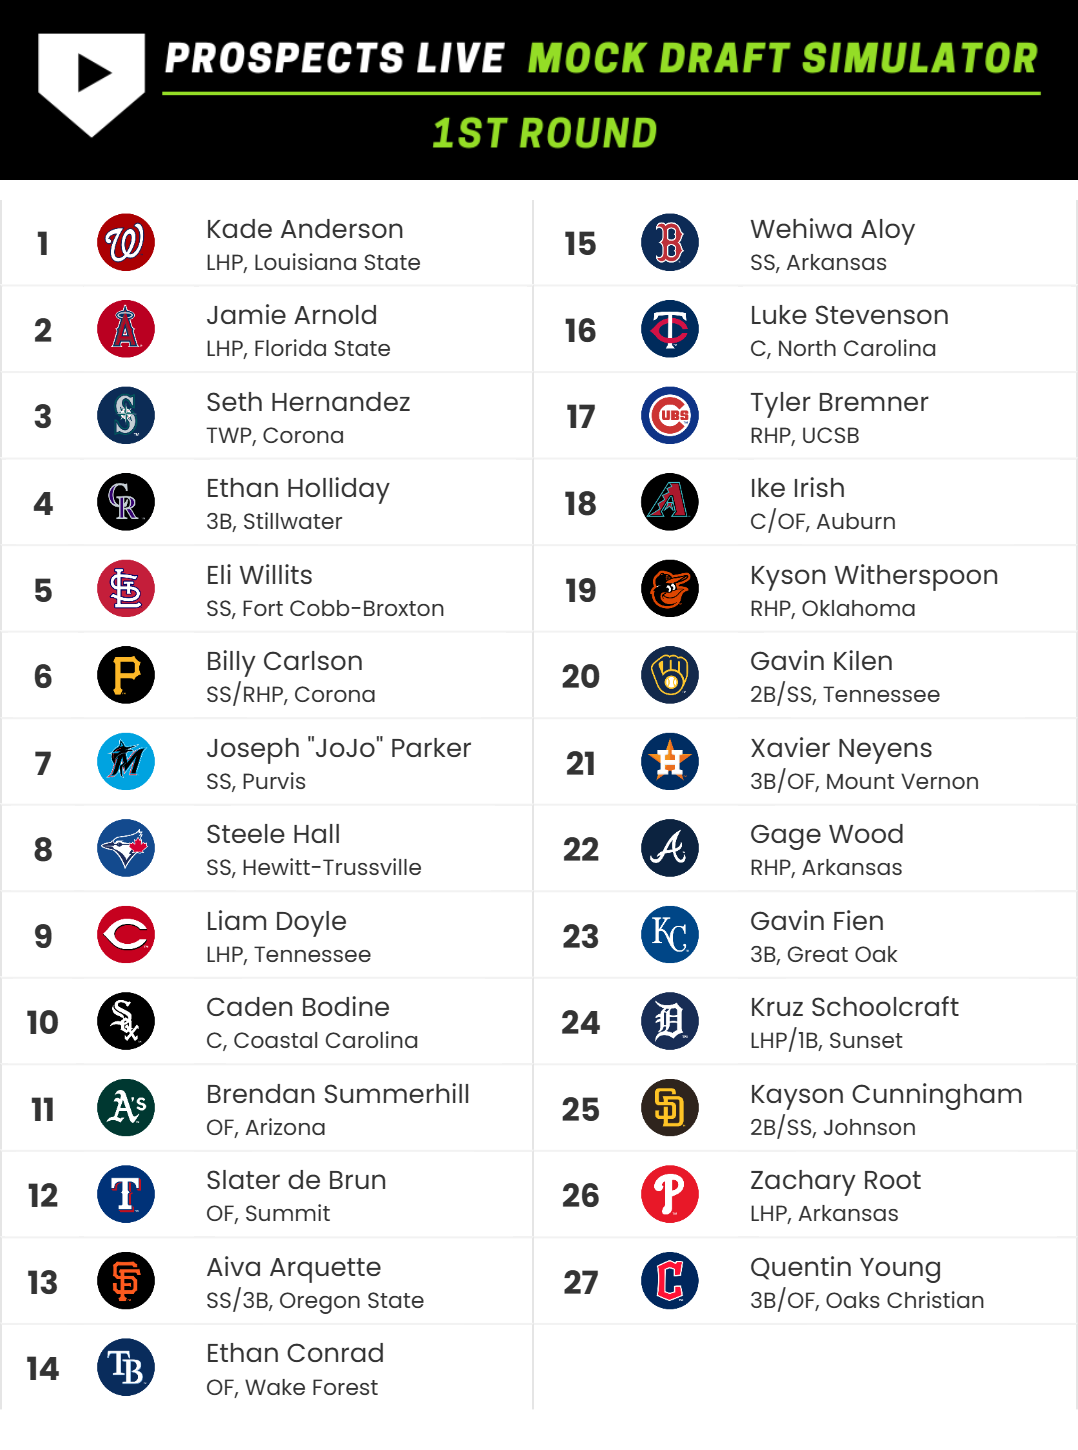
The Most "Chalk" Draft Among the Simulations
As you can see above each player has a percentage assigned to the given pick spot. In order to determine the most "chalk" draft, I added the percentages for each pick across each draft, weighted by the pick number.
Kade Anderson #1, Jamie Arnold #2, Seth Hernandez #3 is:
0.28 * 1/1, + 0.23* 1/2 + .21 * 1/3 + ....
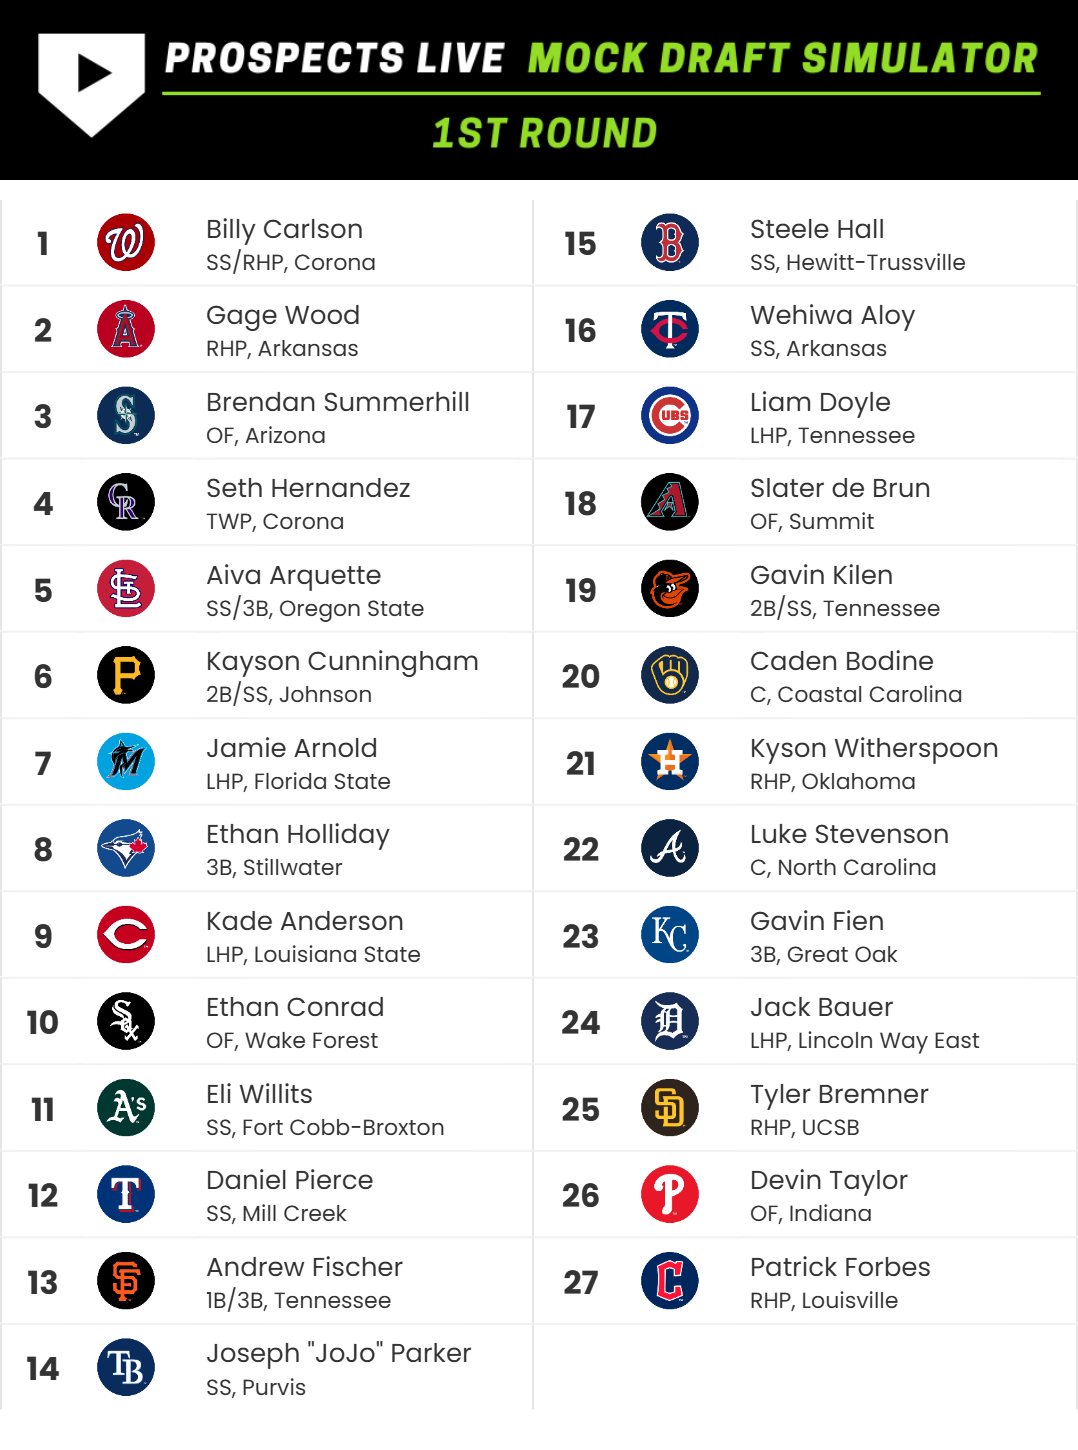
The Most "Wild West" Draft Among the Simulations
Wild wild wild west. No way this happens, but this is the craziest simulation out of the 5,000 generated mocks:
Explore the Mock Drafts Below
You can explore at the 5,000 simulated mock drafts below. Choose a player for a given pick and it'll show you up to 10 drafts (ordered by chalkiness) that contain the players in those spots. I'm excited to explore the results after the 1st round is complete!


Discussion