

This article was originally posted on Medium by Sam Wirth on March 29, 2023.
Intro
It is seemingly impossible not to get caught up in the Spring Training hype that is generated by the flashy young player posting eye-popping stat lines or the pitcher poised for a bounce-back year notching an absurd number of strikeouts. After a long offseason, how can you not obsess over this Jordan Walker moonshot or this Lucas Giolito air-bending changeup? Mainstream baseball publications and fans alike celebrate the success of players every spring. While it is certainly more fun to sit back and enjoy the return of baseball, it is worth determining if Spring Training performance can predict Regular Season success.
I found that due to sample size issues in the spring, base-level statistics, especially on the batting side, cannot be used to accurately predict Regular Season performance. The only stats that stay consistent from the pre-season to the Regular Season are metrics that players have direct control over, like pitch movement characteristics and maximum exit velocity.
Batters
For batters, we commonly characterize weighted on-base average (wOBA) as one of the best descriptors of success due to its emphasis on run creation, rather than arbitrary weights. Unfortunately, Spring Training sample sizes are far too small to provide any meaningful estimation of Regular Season wOBA. By comparing individual player data from 2019, 2021, and 2022 Spring Trainings with the performance of that player in 2019, 2021, or 2022, this finding becomes apparent.

The graph above compares Spring Training and Regular Season wOBA for players with over 50 spring and 100 in-season plate appearances. It could be logical to assume that due to the variability in batted ball data, xwOBACON, a metric that predicts the outcome of a batted ball given its exit velocity and launch angle, would be a better predictor of Regular Season wOBA. However, this is not the case.
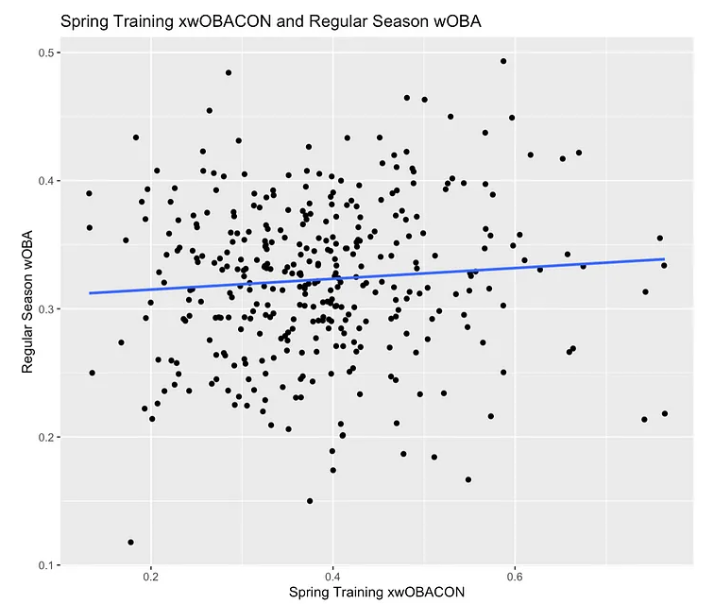
Just like wOBA, pre-season xwOBA holds little to no value in predicting Regular Season wOBA. In fact, using a simple linear regression model, the combination of Spring Training wOBA, xwOBACON, K%, BB%, SwStr%, launch angle standard deviation, and maximum launch angle could only explain 3% of the variance in Regular Season wOBA (R² = 0.0342). Essentially, even the combination of a plethora of Spring Training stats cannot predict in-season performance.
Interestingly, the only Spring Training metric that shows a high correlation with its Regular Season counterpart is maximum exit velocity.
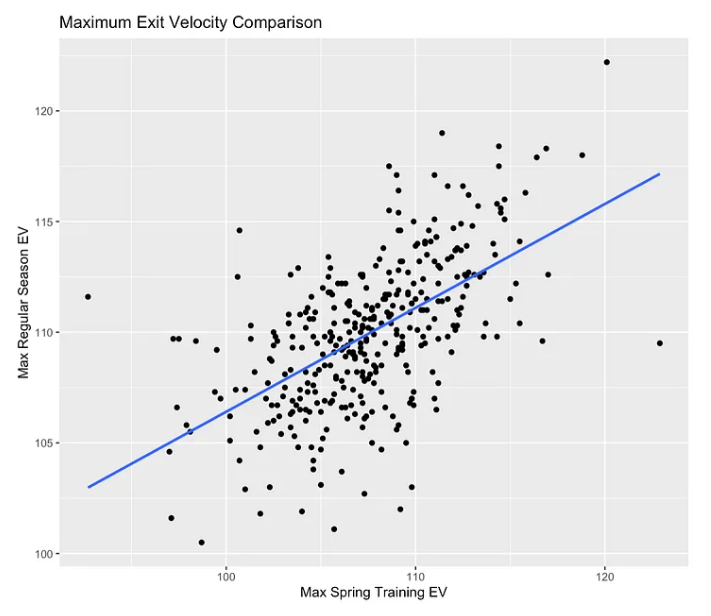
For players with more than 10 tracked Spring Training and 20 tracked Regular Season batted ball events, maximum Spring Training exit velocity explains 33 percent of the variance in maximum Regular Season exit velocity (R² = 0.333, R = 0.578). This suggests that maximum exit velocity is an entirely batter-dependent statistic and is not influenced by external factors. That is to say that if you give a hitter enough chances, they will reach their maximum power threshold, which is represented by maximum exit velocity.
Perhaps this is just a lesson in basic statistics. For the most part, batters do not register enough plate appearances in Spring Training to generate statistics that can meaningfully predict Regular Season performance. Did your favorite prospect destroy a fastball over the batter's eye? Great! Cherish that moment. Did the player your franchise just spent a mindboggling amount of money to sign hit terribly? Who cares! A long regular season awaits them.
Pitchers
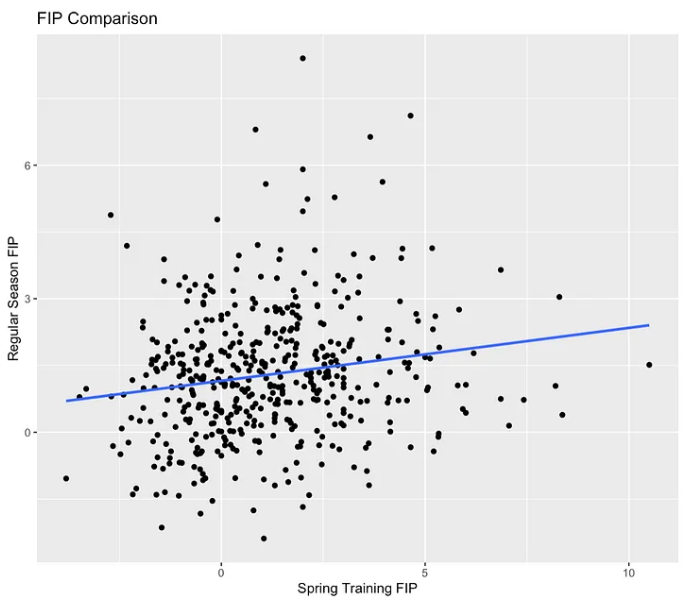
On the pitching side, the same finding is true. Statistics that are under the complete control of the pitcher are far more predictive than statistics that are not, given the minuscule sample size. Take FIP, for example. After narrowing the data to pitchers who threw at least 100 pitches in Spring Training and 200 pitches in the Regular Season in 2019, 2021, or 2022, Spring Training FIP has an incredibly weak correlation with Regular Season FIP.
On the other hand, pitch movement characteristics, like pitch velocity, spin rate, induced vertical break, and horizontal break, are incredibly sticky, meaning they do not vary between the pre-season and in-season. A limited sample size does not hurt the correlation of these metrics because the pitch-by-pitch variance in each is small. After all, if we assume that the velocity of a given pitch has a normal distribution, and we treat the Spring Training velocities of that pitch as a sample of the pitch velocity, then the sample mean of Spring Training velocities will be normally distributed with an expected value of the Regular Season mean. The same statistical principle applies to spin rate, induced vertical break, and horizontal break. That is to say that there will be little variance between movement characteristics between Spring Training and the Regular Season.
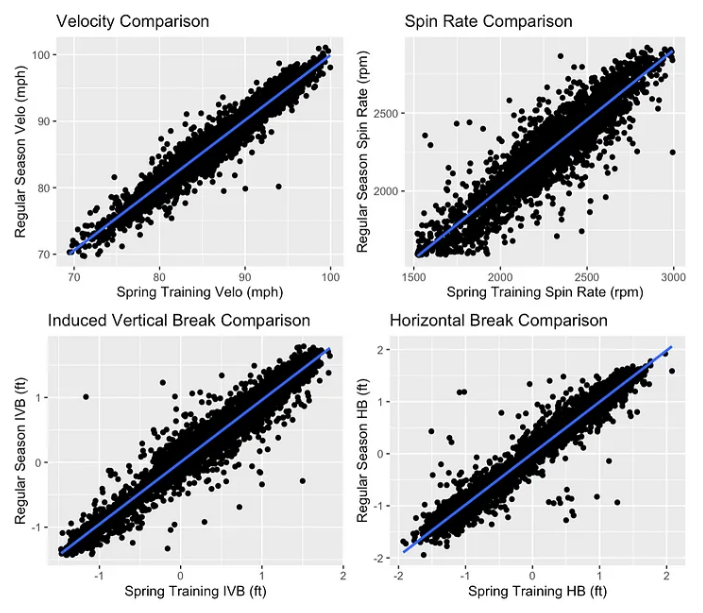
The lowest R correlation value of the four graphs above is 0.912 (R² = 0.831). This means that the movement profile of pitches will barely vary between spring and the Regular Season. So, rather than using Spring Training statistics like FIP to predict in-season performance, people should use metrics that are based on the movement characteristics themselves. Eno Sarris’ Stuff+ is a great example of a statistic like this. A fantastic article explaining the stat can be found here, and his Spring Training Stuff+ numbers can be found here.
Rather than look at the basic stat line of a pitcher’s spring performance to project if they will succeed in 2023, one should look deeply at the movement characteristics of each pitch that pitcher threw. A pitcher pitching poorly in Spring Training does not mean that they will end the Regular Season with poor numbers. It could merely be the case that they ran into bad luck. On the other hand, if the shape of their pitches dramatically changes in Spring, that is definitely something to watch out for in the Regular Season.
Conclusion
Surface-level Spring Training statistics do not matter. Due to an incredibly small sample size, regular season success cannot be accurately predicted by spring batting average or ERA numbers. However, what does matter are the metrics that players have direct control over, like maximum exit velocity and induced vertical break, as these have a much smaller variance in the same sample size as other stats.
At the same time, this might not be the best way to watch baseball for everyone. For me, turning on the first Spring Training game of the year is one of the best feelings in the world. It is great to sit back and watch baseball for the first time in months. For many people, it is probably a lot more fun to enjoy watching their favorite players prepare for the Regular Season than scouring over a Baseball Savant feed to see if a pitcher changed a pitch shape. So, just because few Spring Training performances matter, it does not mean you can’t enjoy them.


Discussion