With the addition of new Hawkeye Tracking systems at the Triple-A level, Statcast Data at the Minor League level is now fully available to the public. This introduces the possibility of performing analysis on pitch-level metrics, something that is currently done at the Major League Level. In quantifying a pitcher’s skill, Stuff models have been extremely important in isolating the factors and reasoning behind why a given pitcher succeeds or fails to do so. Triple-A Ball should be no different. Given that, I decided to create Stuff+, Location+, and Pitching+ models to better evaluate prospects on the cusp of making the Majors. Some background is provided, as well as my methodology and basic levels of analysis to give the user of these numbers a better picture of where they came from and how to use them.
A Brief Primer on Stuff Models
For many of you who enjoy advanced baseball analytics, the concept of Stuff+ should be familiar. If it is, feel free to skip this part. If it’s not, here is a small primer: Stuff+ is a modeling attempt that values a pitcher’s ability to limit runs through the descriptive measures of the given pitch. These descriptive measures can include release position, velocity, vertical approach angle, as well as several other things that relate to the hitter’s perception of the ball after it has come out of the pitcher’s hand. As Driveline so rightfully mentions in their original in-depth look at Stuff+ look in 2021 (linked here), second-order factors such as sequencing and deception are not included in the metric due as it has somewhat been difficult to ascertain and quantify the general skill/luck factor of these variables. Hence, that is the reason why “stuff” is isolated.
But why do you need Stuff? Can’t you look at a pitch's numbers nowadays and determine if it is decent? This is where the new age and old age of looking at baseball intersect. Oftentimes, a batter can articulate whether a pitch is difficult to hit. Sometimes, they can even give an idea as to why it was difficult to hit (“That fastball had so much ride,” “The slider just dived away,” etc). Then, there are pitch-level numbers that can explain why a pitch may’ve been difficult to hit. “That slider had 22 inches of horizontal break - of course, you couldn’t get to it.” These exact numbers give coaches a better picture of the story and allow them to identify relationships with more concrete numbers. Unfortunately, the human mind’s ability to determine relationships is often filled with heuristics (shortcuts) that make people interpret things as they aren’t. We often forget variables or too easily generalize relationships that may have more sticking points. We may positively assign a “good job” to a bad thing just because the human mind struggles to comprehend complex, multi-faceted relationships.
When examining the different variables by pitching, it is incredibly complex. The goal of Stuff+, as well as the other corresponding metrics, is to simplify that. Stuff+ Models (such as the one mentioned in this article) often use machine learning to train these given variables against a decided metric, determining the value that the variables contributed to said metric. Choosing the metric is all about what one is trying to figure out. In my first-ever run-in with college data and Stuff+, I utilized CSW% to see a pitcher’s ability to generate CSWs based on their pitch metrics. Time flew by, and I read a few things, and it became apparent that approximating Run Value was the best approach in determining the worth of a given pitch. Most models that one sees are based on Run Value, although I know of a few at the amateur level that opt for other metrics.
Having both the independent variables and dependent variables, a model is chosen to train, test, and make predictions for what the dependent variable (run value) will be, given certain figures for the independent variables (pitching metrics). The subsequent prediction for this metric is called Expected Run-Value (xRV), which is the basis for all the stuff-like numbers. The prediction is then averaged and then normalized on a basis to treat 100 as that given average. For every point above 100, the player is 1% better than the average at limiting runs based on the pitching metrics chosen. For every point below 100, the player is 1% worse than the average at limiting the runs for his given pitching metrics. From there, one can quickly determine the skill level of a given pitch at limiting runs based on the variables. Looking at one number is a lot easier than 10-15!
Methodology
Before I dive deeply into this part, I want to warn you that this is somewhat technical. I highly recommend reading this if one is genuinely interested in seeing an example and explanation behind the numbers above. Otherwise, you’re free to skip the interpretation following this subsection.
Beginning with data collection, Triple-A ballparks recently got Hawkeye systems, meaning they now have actionable pitch-level data. Using the Baseballr package, the data was scraped and exported to be put in Python for processing, cleaning, and modeling (not a necessity, I simply prefer Python). The raw data that was scraped was somewhat large and confusing in its column naming and configuration, so after a bit of cleaning and reorganizing, the data was beginning to be ready.
As I mentioned above regarding Stuff+ stats, one needs to account for run value and predicted run value in calculating the value of a pitch. Unfortunately, unlike MLB Statcast data, delta run expectancy is not readily available to test the data against. Hence, I had to create my model to assign a Run Expectancy to each state based on Outs, Count, and Runners on Base (like a RE288). I opted to use a machine-learning model for this, although a regular regression could be used (I am currently checking which method I ultimately prefer).
The AutoML feature from the FLAML library in Python was used for the model type. This feature iterated through many different model types and parameters until it settled on a model that minimized the RMSE between the predicted and actual runs generated on average. The usage of AutoML deserves its article in a baseball context, but some knowledge of it is needed to understand my thought process. Hence, the model uses a resampling strategy to influence a constantly updating learner to adjust the hyperparameters, model types, and sample sizes of different sci-kit learn models being used based on a given time budget, comparing the time it takes to build an improved model versus the time available. It’s always about minimizing time and making the most accurate prediction, which has precise use in baseball. It's very much simplified, but still.
These run estimates were then mapped from that matrix, assigning a run value to every single play/pitch that happened. From there, an additional column was created to calculate the delta in run expectancy from the previous pitch. Each pitch row now has a Delta RV column, similar to MLB data. To adjust for the fact that run environments and other external factors could unfairly hurt a given pitcher, each play result event was assigned a numerical value based on the average change in run expectancy. These run values were then mapped to a new column based on the corresponding play result, which provided a more fair and accurate y-variable for the Stuff+ model to train against. Now, it is possible to predict run values based on given pitch metrics accurately.
Now, with the y-variable in hand, all that's needed are the x-variables to start training. Using my experience with Player Development models at the college level and messing with data in the pybaseball library, I was very aware of what factors seemed to matter more than others in determining pitch outcomes. While I will leave the exact variables utilized closed at this time, adequately adjusted metrics such as velocity, movement, release position, and approach angle, among other things, were all included. The Location model just used a given pitch’s location. The Pitching+ model just added the variables of the Stuff+ and Location+ model together.
Of course, just having the variables isn’t enough to predict performance - the pitch count and the pitch type can all have an unwanted impact on the expected numbers. Hitters tend to do worse in specific counts and against certain pitch types, skewing the variables if a pitcher happens to go to given counts and pitches more than the general population. Their Stuff would more represent their tendencies than their skill level, which this model aims to avoid. To adjust, dummy variables were added for each pitch type, as well as the given count. These dummies were all added to the given variable group of the models, hence accounting for all the x-variables that were deemed necessary at this time (there is room for improvement, and V2 is already being worked on).
The model was set up and trained with both the x and y variables, again using the AutoML function from the FLAML library. The Stuff+ model ended up settling on an XG Boost Limit Depth Estimator, while both the Location+ and Pitching+ opted for an LGBMEstimator with differing parameters. Each model has different x-variables and calculates different relationships with pitches, which justifies using different models to predict data more accurately, as the complex relationships likely differ in nature. This is being further looked into and may change for the sake of optimizing results and consistency.
The scores then utilized the xRV predicted by the models and then were normalized based on the z-score relative to the mean. The averages are set so that each pitch’s average performance is 100, rather than the entire dataset being an average of 100. Ergo, a 100 SL likely limits runs better than a 100 FF. There is an argument to be made regarding the usage of one average run value overall in articulating actual value (in terms of runs or dollars). However, for the consideration of development and comparison, such as when evaluating whether a Pitcher has 2 or 3 “Plus” Pitches, setting 100 as the average for a given pitch is likely more helpful. I also didn’t want to deviate from the industry standard at this point, as this is just the first iteration of the model. A future calculation may consider both overall and relative scores.
Arsenal scores were weighted based on the usage of a given pitch. The reason behind opting not to weigh evenly was primarily based on sample size, with a given pitcher potentially having a skewed score if the Cutter he happened to throw less than ten times happened to have a high score with low confidence. This is avoided through an overall mean of the different scores for each pitch. These numbers should be considered with sample size in mind, as players with a minimal amount of pitches can have much more variable and less significant scores.
This lays out my thought process, with the goal of this project being to more accurately articulate areas for improvement or strategy within a Minor League system. There are various choices about a pitcher’s arsenal that could be made with these numbers, including the possible elimination or increased dedication towards a certain pitch. If a Player Development staff knows that a given player’s pitch is 6% below average on the Triple-A level, they could opt to train more specifically on that pitch to eliminate a potential weak spot that batters can exploit. To that same end, they could deem a certain pitch a lost cause, allowing a given pitcher additional time to work on his other pitches and improve where he is already strong. Figuring out the relationships between certain factors and pitches from said models could also add great value, which will be shown in the following.
Interpretation
The numbers are available now - you can access them in the ShinyApp I created that is linked to this article. But what do you do with them? The reader knows how to measure Stuff/Location/Pitching+, as is implied by either reading the above primer or opting to skip it. The following measure comes in actually analyzing it. If one opts to create a model, writing up some code and determining the important variables is relatively easy. That is what I did, although important variables are far from everything. They don’t reveal the given relationship - instead, just how much the model considered the given factor. To consider the relationship thoroughly, regressions between certain factors and their predicted metrics can be run to estimate the value better. So, let’s run them!
Fastballs and Vertical Break
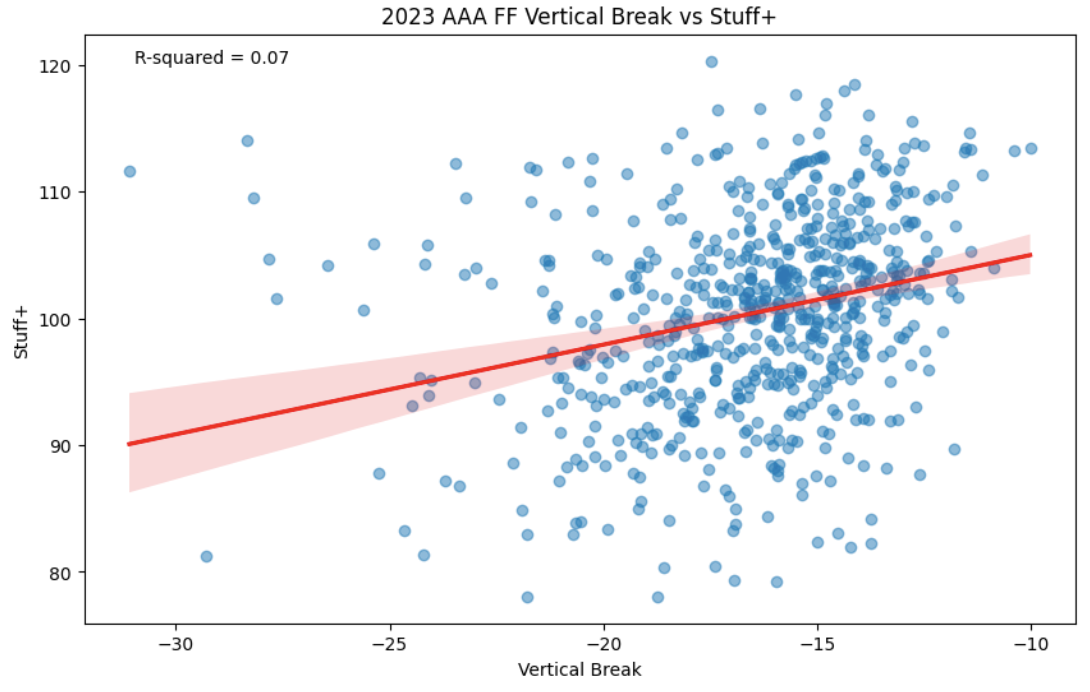
The first concept to be addressed is the issue of vertical break and Fastballs. Oftentimes, it seems that players want to limit the amount of break so that the ball can exhibit a flatter profile, staying above the swing plane of the batter. This plays into the Vertical Approach Angle, but to answer the above question, we’re mainly going to consider Vertical Break. To measure this relationship, below is a regression of the spin-induced vertical break of a fastball compared to its Stuff+ value. The values are aggregated by pitcher pitches that have been thrown over 100 times in an attempt to filter out some of the noise from the dataset.
The relationship between Vertical Break and Stuff+ in 2023 AAA on Pitcher Fastballs (minimum 100 thrown).
As you can probably tell from the graph, a minute but existent relationship does seem to appear between less vertical break and improved Stuff+ numbers. A 0.07 r-squared score is very small, and in actuality, it’s estimated that only 7% of a change in Stuff+ could be owed to a change in vertical break. Nevertheless, this is evidence that less vertical break does have a minor impact on limiting runs.
Curveballs and Spin
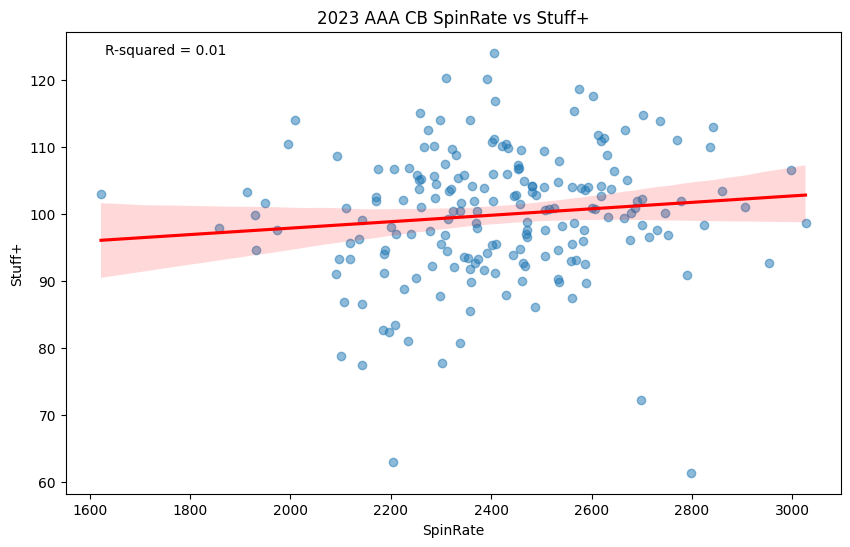
The general motto in Curveball Development is that you want a pitch that spins more. Of course, other factors matter also, but Spin is a big one that tends to be highlighted when citing the supposed “nastiness” of a given curveball. Is there any truth to that?
The relationship between Spin Rate and Stuff+ in 2023 AAA on Pitcher Curveballs (minimum 100 thrown).
No, not really! Having an r-squared score of 0.01, the relationship between Spin Rate and a Curveball limiting runs is random. You’ll also find a similar relationship if you use Baseball Savant’s graphing tool for Major League data. Other factors besides Spin seem to make a much bigger splash in determining the value of a Curveball.
Changeups and Extension
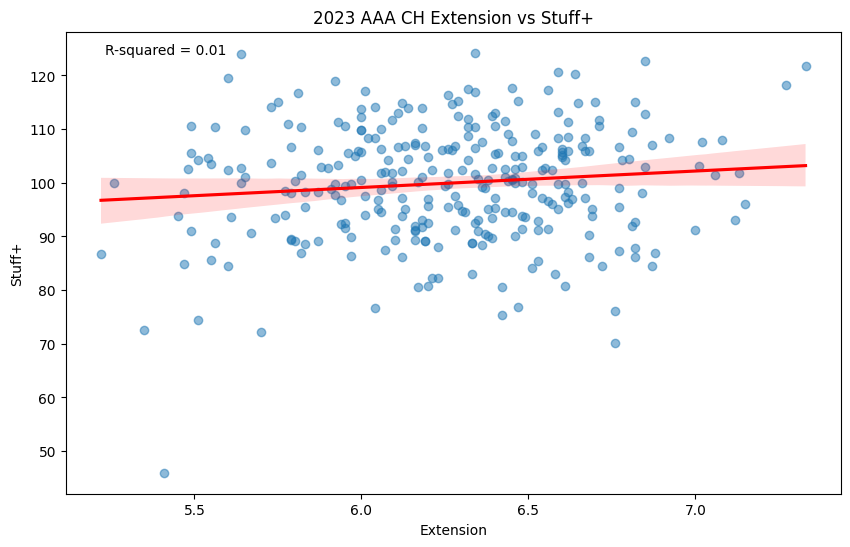
For offspeed pitches, limiting extension has been prioritized, as it allows the pitch more time to break due to the increased distance of travel from the hand to the catcher’s glove. Changeups are included in this category, but does it help with performance?
The relationship between Extension and Stuff+ in AAA on Pitcher Changeups (minimum 100 thrown).
Another almost completely random relationship. The amount of extension that a given player had on their changeup seemingly did not matter at all in how their changeup performed in limiting runs. Knowing that, there are definitely other factors that a Coach could focus on.
Conclusion
Stuff/Location/Pitching+ are not new concepts, but with alteration, they can continue to be adjusted to provide a more accurate estimate of what might happen given certain circumstances. The methodology discussed provides a clear view of my entire thought process throughout the matter, and also demonstrates my desire to improve the model from its current point. After all, no v1 is perfect. With the model in mind, I provided a few examples of ways that certain aspects of pitches could be more properly valued based on their expected run value for “stuff”. These examples were meant to be simplistic in sharing how it can be used, and not for the sake of in-depth analysis (that can be saved for other articles). Hopefully, it provides a great starting point.
Despite how useful I believe these numbers are, they aren’t everything. In an interview with The Athletic, new Angel’s Pitching Coach Barry Enright discussed the relationship between using data and pitching in general, “There’s so many different ways that you can look through the pitch data to help with usage to help with pitch location and to help the pitch design. But if you forget that you’re out there to get the batter out, you’re behind the eight ball.” He is spot-on - numbers like these can be extremely helpful, but they aren’t everything. A player may be able to generate great “stuff” and just absolutely fail to keep the ball in the zone - there is no value in that. These numbers are meant as estimates, and if treated as such, I believe they can ultimately be beneficial to a club.
While I elected to keep some of the parts private, I would be more than happy to help anyone dealing with developing a similar type of model or answer any questions regarding further specifics on how the model works. Please feel free to message me through any of the contact info within the ShinyApp.


