Cristian Pache

The Minor League Daily Sheet: June 10th 2021

The Minor League Daily Sheet: June 10th 2021

June 10th! Are you ready? Ready for what, you ask? Oh, just the top performances around the minor leagues on a Thursday night. Ho hum just another grip of writeups to keep you as informed as possible as you head into your weekend. As always Geoff Pontes handles Triple-A and Double-A, Rhys White is the man for your High-A needs, and Matt Thompson has friends in Low-A places. Let’s get this bread!

The Minor League Daily Sheet: June 5th 2021

The Minor League Daily Sheet: June 5th 2021

It was a hell of a Saturday night, we had parties, little league playoff games, and heavy drinking to do. So we’re rolling a little late today, but it’s all good because Geoff (Triple-A/Double-A), Rhys White (High-A), and Matt Thompson (Low-A) are here to walk you through the top performers in the minor leagues from June 5th 2021.

2021 Bowman Baseball Preview

2021 Bowman Baseball Preview

Previewing the first major prospect release of the year for baseball cards with 2021 Bowman Baseball

2021 Topps Series 1: Bohm's Away

2021 Topps Series 1: Bohm's Away

Reviewing the upcoming 2021 Topps Series 1 baseball card release with a focus on the rookie cards in the product.

Best and Worst of LIDOM - Week 2

Best and Worst of LIDOM - Week 2

Phillies relived Ramon Rosso has performed extremely well over the first two weeks of the season. Here’s the best and the worst so far of LIDOM.

Breaking Down All 109 of MLB's 40-man Addition

Breaking Down All 109 of MLB's 40-man Addition

If you’re wondering why certain players got added to a team’s 40-man roster, take a peek to see the reasoning and learn about them.

Top 10 Prospects of Each NL East Team

Top 10 Prospects of Each NL East Team

Led by the Braves, the NL East has some resurgent systems that’ll shake up the division before long.

Minor Graphs Update - Spray Charts Galore!

In recent weeks Minor Graphs has received a face lift and some new features. While these past updates probably deserved their own post, they were pretty straightforward to explain in our tweet announcements. However, this most recent update has so many options involved that it wasn’t possible to highlight all the features in a single tweet or thread. So let’s get to it!

Multiple Spray Charts navigation and creation

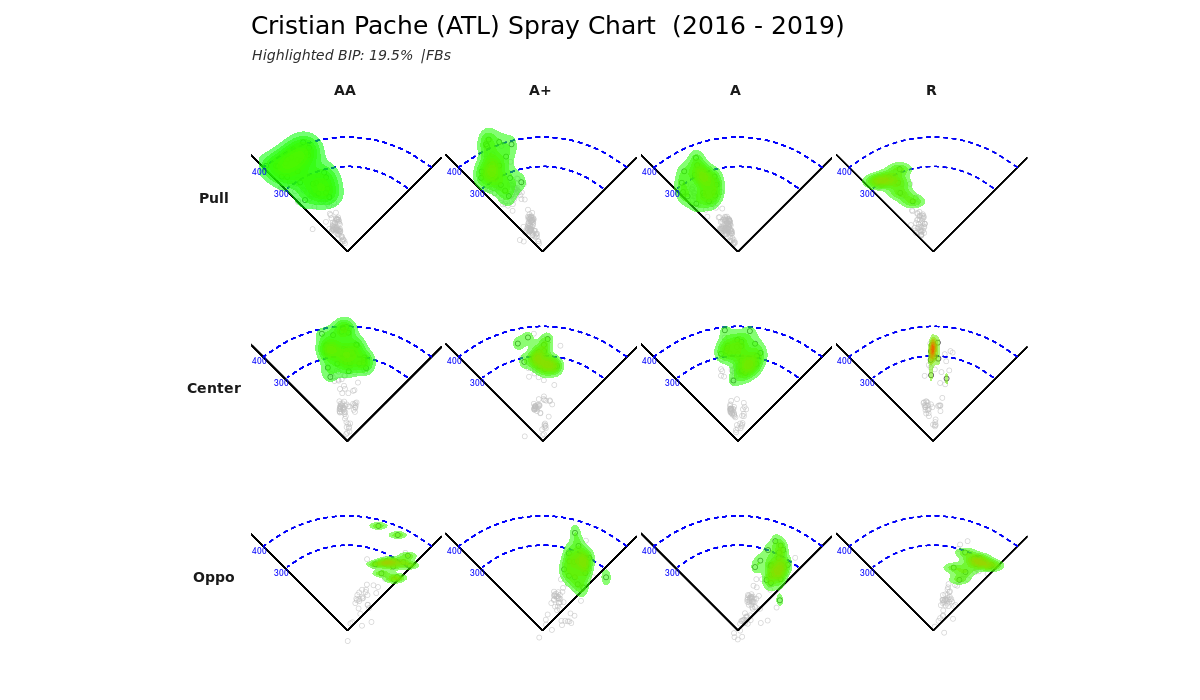
The inspiration came from Bill Petti’s baseballr spray charts function. The ability to see side by side spray charts by year does a great job showing the progression of a player’s batted balls. It seemed like a natural progression from what was existing in our interactive spray charts that give the user the ability to filter, color and highlight by different variables. So the new multiple spray charts feature is an extension or the current spray chart options.

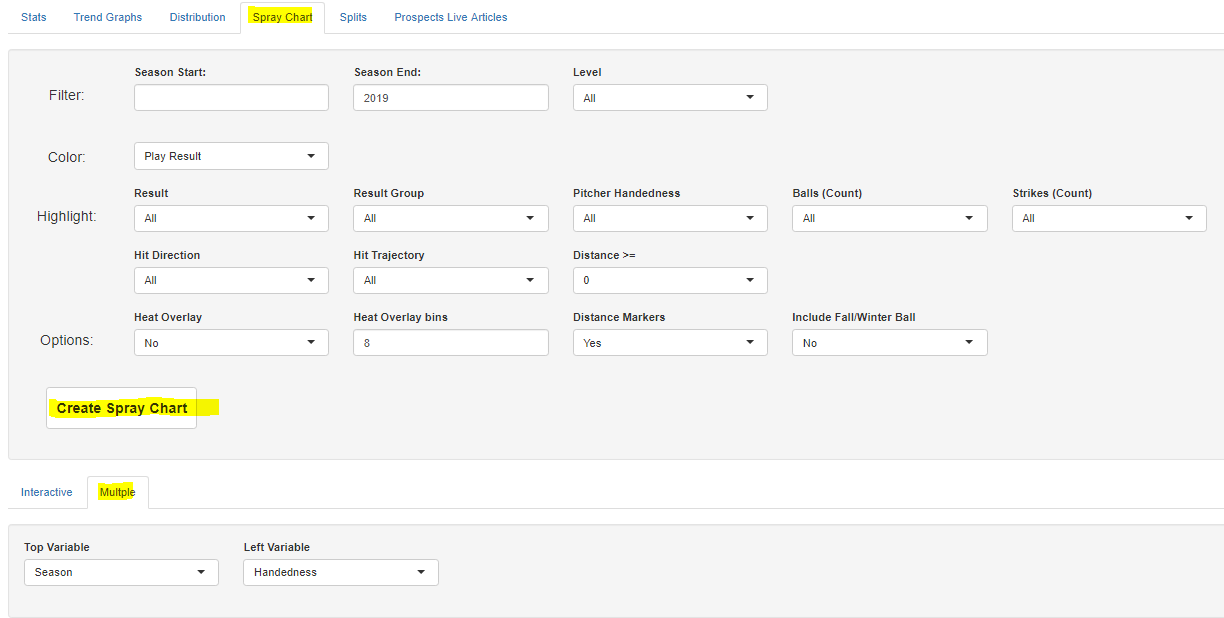
To create them, go to the “Spray Chart” tab, scroll down and click the “Multiple” tab and hit the “Create Spray Chart” button. Here is a screenshot of the new navigation:

MultipleSprayNav.PNG

Notice the two new variables that appear once you click on the “Multiple” tab - those will control the breakdown of the multiple spray charts.

  • Top Variable options are either Season or Level. The spray charts will always appear w/ the highest Season/Level to the left.

  • Left Variable options are either “Handedness” of the pitcher, “Direction” (Pull/Cent/Oppo), or “Trajectory” (FB/LD/GB/PU). Whichever variable is chosen will show up top to bottom.

Multiple Spray chart default selections

Using Cristian Pache as our player, let’s go through all the options to see what we have at our disposal!

Season by Handedness

SeasonbyHandedness.jpg

Season by Direction

SeasonbyDirection.png

Season by Trajectory

SeasonbyTrajectory.png

Combine w/ other “Color by” Variables

Remember that we can change change the “Color by” variable to be any of these options: Play Result (shown above), Hit Trajectory or Hit Direction, so we can use combinations to create custom spray chart grids.

Level by Handedness, colored by Direction

LevelbyHandcolorDirection.png

Use highlighting variables to drill down further

We can also highlight by any of our normal highlighting options in the interactive charts. Let’s use the chart selections above, but only for fly balls.

Level by Handedness, colored by Direction, for only Fly Balls

LevelHandDirectionFB.jpg

Level by Handedness, colored by Trajectory, for only Pulled batted balls

LevelHandtrajectorycolorpullonly.jpg

Adding Heat Overlay to Multiple Spray Charts

This is where I personally think it gets really fun. The charts above are helpful to identify a certain change in the “color by” option like Hit Direction. However, the heat overlay really helps give a quick visual of how the batted ball distribution changes from one spray chart to the next. All you have to do is simply change the “Heat Overlay” option to “Yes” and click Create Spray Chart. The only thing that changes is that we no longer have the “color by” selection working because we have the heat on top of it. Let’s look at a few different spray chart grids we can create w/ the heat overlay.

Level by Direction w/ Heat Overlay

LevelDirectionHeat.png

Level by Direction, FB only w/ Heat Overlay

LevelDirectionFBHeat.png

Season by Handedness, extra-base hits only, 2017-2019 (excluding 2016) w/ Heat Overlay

SeasonHandednessxbh201719.png

Other New Spray Chart Options

Now let’s look at the options themselves as a few new ones have been added!

NewSprayOptions.PNG

The drop-downs highlighted in yellow are all new!

  • Result Group allows you to highlight only hits (exclude outs) or extra-base hits (exclude outs and singles) - shown above!

  • Heat Overlay bins changes the size of the highlighted area of the spray chart when the Heat Overlay option is set to “Yes”. Typically a smaller number will be better for a smaller number of highlighted balls in play.

  • Include Fall/Winter Ball when set to “Yes” will include available data, particularly from the Arizona Fall League (AFL). I’m not 100% sure what other leagues are included, and if they are, if the data from those leagues have all games tracked.

Other changes to the options (not highlighted in yellow are to:

  • Level now includes groups and not just single leagues. So you can now highlight “All MiLB” to exclude MLB batted balls, “AAA/AA” to see the group of batted balls only in the high minors, and “Winter” to isolate those batted balls.

Here are some examples of spray charts using the new options:

Extra-base Hits, AAA/AA only

SprayAAA-AAxbh.PNG

Level (w/ AFL) by Handedness w/ Heat Overlay, bins = 8 (default)

LevelHandHeatbins8.jpg

Level (w/ AFL) by Handedness w/ Heat Overlay, bins = 15

LevelHandHeatbins15.jpg

That’s it! Hope you enjoy making some custom spray chart grids. As always, check out that and more over at Minor Graphs on the site.


April Prospects of the Month

April Prospects of the Month

The minor league season is officially into its second month — May is upon us. There was a lot to digest in the opening month of 2019 and, amidst the injuries, promotions, and MLB debuts, several performances went unnoticed. We went digging to make sure we spotlighted someone that you might’ve missed.

2019 Southern League Preview

2019 Southern League Preview

The Southern League is stacked with top-100 prospects, as a whopping 11 of our Prospects Live top 100 will begin the season in the southeast with even more likely to reach the Southern League on their trek to the majors.

2018 Arizona Fall League Preview: Peoria Javelinas

2018 Arizona Fall League Preview: Peoria Javelinas

The Peoria Javelinas’ roster is comprised of players from the Atlanta Braves, Milwaukee Brewers, Tampa Bay Rays, San Diego Padres, and Seattle Mariners. A case could be made that the Padres, Braves, and Rays are the top three organizations in the game when it comes to prospects, but, at first glance, the Peoria squad appears to be lacking firepower.