
Update: Arsenal+ Scores are now included in the AAA Stuff App, which is linked here.
As more and more pitching data becomes available to the public, the attempt to understand that data has only grown. One of the premier ways that has been used to understand these Pitch-Level numbers is the creation of Stuff-like metrics, (like Stuff+, Location+, and Pitching+) that use machine learning to more accurately predict pitch performance. Recently, I had the pleasure of creating these models for Triple-A Pitchers, which were published on Prospects Live. The explanation behind the models and the link to the data is here if you’re ever so inclined, but reading it all isn’t necessary for this piece.
Building the models, it kept dawning on me that while these models are helpful, they are admittedly limited. After getting the chance to have a conversation in a chance encounter with Eno Sarris at the Winter Meetings regarding said limitations, I left with the hope of creating something better. In identifying the current weaknesses of the metrics being used, the primary one worth noting was that these did not consider the prior pitch that was thrown. For example, a high four-seam’s Pitching+ gives no consideration to how it plays off the slider that was down-and-away beforehand. It is somewhat established in general baseball knowledge that a given pitch can be more effective depending on the prior pitch thrown. But with the lack of consideration by notorious models, perhaps it does not.
This turns into a hypothesis test - either the current models are more effective at evaluating pitching with their current considerations (the null), or they forgot a deeply important component and general baseball knowledge is right (the alternative). The creation of Arsenal+ aims to answer this question and further evaluate the various elements of pitching.
What is Arsenal+?
Arsenal+ considers the stuff and location of a given pitch within a pitch type, as well as consideration of the prior pitch type and the difference in these numbers. With Stuff+, Location+, and Pitching+, the main differences in the models creation was in how a given model was selected, what model was selected, and the exact feature variables being used. The models in the AAA app were pitch and count-adjusted just like others, as I did not feel that it was my place to augment the way that Stuff+ is calculated based on the given predictions. On the other hand, Arsenal+ is a new model entirely, allowing the metric to be further adjusted as deemed fitting.
The metric was created and tested on both 2023 Triple-A Statcast data (like the other App models) and 2022-2023 MLB Statcast data. To make the metric more accurate, I first opted for the similar steps that I followed in advancing the Stuff+ model process. In selecting variables, I went for the same variables as in Pitching+, but precisely added variables for the difference in these from the last pitch, as well as dummy variables for the prior pitch thrown. The independent variables relating to the Pitching+ aspect primarily focused on pitch movement and acceleration, as well as the end-location of said pitch. In calculating the difference aspects, take the variables velocity and velocity_diff - if a slider was thrown 83 MPH beforehand and the fastball being evaluated is 95 MPH, the variable velocity_diff would equal 12. The same type of thinking goes for all the other difference metrics. The dummy variables are pretty self-explanatory - if the prior pitch was a slider, a 1 is in the place of the prior pitch slider column. In theory, these variables allow for a better picture of an arsenal in measuring the value of pitches.
Each group of pitches were separated by PA, so the first pitch of a given PA was trained on Pitching variables alone. There was a debate as to do with the first pitch - it was kept in the model as pitching metrics have a good deal of influence already, and the first pitch may have an overall affect on how the rest of the PA plays out. A dummy variable was added to differentiate between when a pitch was the first of a PA.
Needing a dependent variable, all of the Triple-A models were moved to a 2023 AAA RE288 basis for run value, with each delta in run expectancy derived from the change in each base-out-count state. This is slightly different than the first model, which utilized a machine-learning model to predict runs based on base-count-state. A prediction was trying to be made on a prediction, which seemed to be a bit far out from reality. Within MLB’s Statcast data, there is data regarding the delta run expectancy of each pitch - this was the dependent variable for that version.
The automated machine learning process from Microsoft’s FLAML library was again used to ensure the most optimized model type and parameters - for both the AAA and MLB model, it ultimately landed on an XGBoost Limit Depth Estimator. The test RMSE was 0.029 for AAA and 0.198 for MLB (both of which were the best out of all models) when comparing actual and predicted run value over the entire sample. In an attempt to make the models even more accurate, an increased amount of variables were normalized for: count, pitch type (both of which were already included), batter-pitcher matchup, and whether men were on base or not. While a more in-depth explanation will be provided on all of these later, the primary goal was to limit unearned credit.
The actual scores were then established by taking the z-score relative to the average of these pitches, which yielded the Arsenal+ number, treating 100 as average for each pitch type, and any point above or below acting as the percent difference from the average (an 87 Arsenal+ is 13% below average, etc). Each model was relative to the level the data was trained on - an 100 Arsenal+ on the MLB Scale does not equal an 100 on the AAA scale.
Arsenal+ is like a Pitching+ metric on steroids, using similar variables but treating pitching performance evaluation as being dependent on the change from other pitches rather than independent. Like Stuff+ and the other pitch level metrics, the goal of this metric is to both be more accurately telling of skill and more predictive of pitching performance. From that, pitching as a whole can be more thoroughly understood.
In considering development, developing pitches and focusing on said elements of pitches that play well together versus solely highlighting stuff and location for a pitch could potentially lead to a higher rate of development success. This is likely already done to an extent at organizations, although the industry's tendency to overhype pitch values independently leads me to believe that it may not be a main focus.
From an evaluation perspective, pitchers with less-than-ideal Pitching+ numbers may see a boost if they happen to throw pitches together consistently that play nice with one another. To explain further, Pitcher A’s Fastball could not have a great Pitching+, and his Arsenal+ could be above average if he happens to throw it often after a Changeup that plays very well with the Fastball. It could work in the inverse - Pitcher B’s focus on individualistic pitch numbers hurt his Arsenal+ and could be more explanatory of his performance not catching up with his stuff. Each option completely changes the value equation in acquiring a given player. Through both of these considerations, such a metric could hopefully add to a club’s bottom line in terms of a talent pipeline, given its validity.
Evidence
The investigation into the possibility of an effective Arsenal+ model was looked through before this piece - there is no point in producing a metric that has no increased value to what is currently available. Luckily, this one does add value. As mentioned in the introduction, the effectiveness of such a metric would answer whether to accept that the current models consider all the relevant factors needed for pitching evaluation and prediction (the null) or go with general baseball logic in considering how pitches play off one another to be more accurate (the alternative).
From the findings below, I believe it is fairly safe to reject the null and assume that more considerations need to be added for a skill-based pitching model, which is Arsenal+. Through extensive testing and reworking, the results regarding the overall predictiveness as well as the effectiveness of the model on the training data proved to be fairly significant. As previously mentioned, models were conducted at the Triple-A and MLB to be as thorough as possible. The model was originally made to serve as an addition to the Triple-A models made prior and then was retrofitted for MLB data to ensure its overall integrity and value as a metric.
AAA Data
Given that there is only one current season of AAA data available, measuring the model’s success was done by splitting the dataset into two - the first half of the season and the second half of the season. The results were measured by the success rate at which the first-half model results were able to predict the second-half actual results, in terms of run value.
With the models being tested over aggregated stats of a given pitcher’s pitch (in an attempt to block out noise) and to see model performance over different sample sizes, a recurring regression was set to reset after a one-pitch increment increase each time a pitcher had a pitch that met the minimum sample requirement for both sides. To clarify the chart’s meaning in a hypothetical, say over 1000 pitchers pitches (the number of samples) have at least 50 thrown during the first half and second-half of the seasons. The regression is taken on the 1000 pitchers pitches, plotted as the minimum sample on the x-axis, and then the threshold is reset. The minimum is now 51 for each side, and the number of samples shrinks to 998 (as denoted by the right y-axis and the background shading). A new regression is then taken, and the process keeps repeating. These charts will continue to be used throughout the explanation of Arsenal+.
In the first measure of potential success, the r-squared score between the first-half Arsenal+ scores and second-half RV100 scores were compared. On the off-chance one is not familiar with RV100, it is the run value added per 100 pitches thrown. To put both numbers on the same scale and ensure accurate predictive value, the Arsenal+ adjusted xRV100 prediction was used (only for this measure). To set a baseline for the number, the RV100 half-over-half performance was considered to measure how much stickiness to expect in a player’s performance in general.

The chart allows the strengths and weaknesses of the given model in predicting pitcher performance as sample size fluctuates. The bar chart in the background allows the reader to consider the tradeoff between the number of samples and the minimum sample size during the experiment. The visual cuts off at 250 due to the lack of a significant number of samples, sending the scores all over in what is not indicative of model performance. Other than for a few slight points in the beginning that have predictive outliers, Arsenal+ proved to be significantly more predictive of second-half RV100 than first-half RV100. So, it is relatively safe to assume that using Arsenal+ to estimate second-half performance will likely be more accurate than just considering the non-regressed first-half performance.
That’s the easy part - the hard part is beating the current models that are highly valued by the baseball community in Stuff+, Location+, and Pitching+. The models being compared will be the ones that were made prior in the AAA Stuff App, just with the additional change to a RE288 basis as mentioned. This chart also demonstrates how each predictive model performed when tested against RV100 second-half data.

In comparison to the other models, Arsenal+ did take a longer time to solidify predictive value, needing roughly 30 pitches before the projections evened out. Once the minimum pitch requirement reached around 130 pitches, Arsenal+ remained above all the other metrics for the rest of time, only tailing off slightly at the end. While each number on the graph was deemed statistically significant, the P-value moved toward 0.05 as the chart continued. Another aspect to check in terms of overall predictive value is the RMSE (root mean squared error) score throughout the sample, which measures the standard error between the predicted values of the model and the actual results, as shown below (the lower, the better):

As is made obvious by the chart, the RMSE of Arsenal+ was greatly lower than all of the other metrics. With that in mind, it seems clear that Arsenal+ had superior predictive value when a pitcher’s given pitch was thrown more than 130 times. Before that, the predictive value is somewhat up in the air. In terms of stabilization, the stickiness (a metric’s ability to predict itself) chart of each stat matches up with that conclusion - Arsenal+ is not one to quickly predict itself compared to the other metrics.

Stuff+ and Pitching+ originally proved to be the most sticky when having to deal with a lower minimum pitch throw filter, although Pitching+ was eventually caught up to by Arensal+ around the 200-pitch mark. Both metrics showed a greater ability to stabilize quicker, so this is in line with what is to be expected. A variation in sequencing strategy may partially augment a given pitcher’s Arsenal score, making the metric seemingly less predictive of itself when in reality it’s just considering a broader range of factors that can be more variable in general.
While it was originally suspected that Pitching+ would be its biggest competitor, Stuff+ surprisingly competed the most, proving to have lots of predictive value and stickiness. It may take longer to consolidate its predictive value, it is generally more predictive in the long term when given an increased sample size. Given that these numbers provide sound evidence at the Triple-A level, back-testing it through MLB data will ensure that this isn’t a subject of chance.
MLB Data
There are multiple years of Statcast Data at the MLB level, so the years 2022 and 2023 were selected to conduct testing to make sure that it is taking into account the most recent Stuff improvements by players. Model success was rated on the ability of the 2022 scores to predict 2023 Run-Value performance, which was all derived from the delta run expectancy provided by Statcast.
Similar to the AAA data, the first test conducted was to ensure that the model could beat the most basic form of prediction - prior performance of the same metric. This was again done by comparing the r-squared values, using 2022 RV/100 and 2022 Arsenal+ RV100 to predict 2023 RV100. The total number of samples is again included to provide additional context. The scaling is somewhat different, as the increased sample size led to the values having significance until the number of samples had roughly a 500-pitch minimum.

While the two lines did merge around the 400-pitch minimum mark, for the vast majority of the time, the prior season’s Arsenal+ appears to be more predictive of next season’s RV/100 than simply taking the past performance for the same metric. The relationships may not be as strong as those in the AAA sample, although this is likely due to the adjustment of considering half-over-half performance versus year-over-year performance. A player is likely to see more variance in skill over multiple years versus just a singular season.
Given that the MLB version of this model was able to outperform the basic benchmark, testing was conducted against other Major League models for Stuff+, Location+, and Pitching+. Each model was based on the delta run expectancy provided by Savant.

Like the AAA model, Arsenal+ was able to outperform all of the other Stuff metrics in predicting future performance. Excluding the outliers before the 50-pitch mark, Arsenal+ was ahead of every metric by a few points through the 500-pitch minimum sample size. Again opting to analyze the entire dataset on RMSE as well, it managed to outperform the other models, although the margin was narrow.

While narrow, it was enough to prove some superior value. With the same model proving more predictive than the competition at both levels, it is hard to deny legitimacy. In analyzing each model further, it is important to consider the stickiness of the metric. The context of AAA data was already provided earlier, and the predictive nature of the MLB-level models have already differed. Hence, the stickiness at the MLB level:
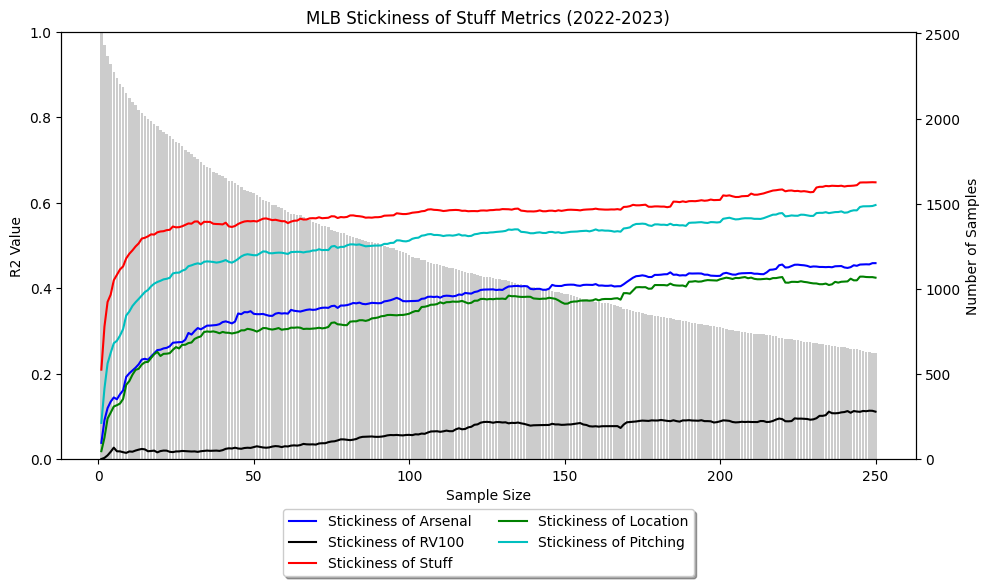
Unlike the AAA model, the stickiness of these models stayed relatively static with the change in sample size. Stuff+, again, was the most predictive of itself out of all the metrics. Arsenal+ remained in the middle of the pack, which is what can be expected due to the variables it utilizes. The increased sample size at this level gives more confidence to these results, and the true rate of stickiness is likely closer to the level observed with the 2022-2023 MLB data. The model, again, gained accuracy as each sample became closer to a given player’s true talent level, which leads me to reiterate the importance of having significant sample sizes for the model’s accuracy at prediction.
Testing against Fangraphs
With any new metric, one has to be as thorough as possible. While I believe my models to be solid in overall predictive value, without actually knowing the success of the others, there is no public context. To limit bias and any possibility of illegitimacy of this metric, it was tested against the gold standard: Eno Sarris’s Stuff Models, or the models available on Fangraphs. All of the model scores, as well as the standard RV100s, can be easily pulled through the pybaseball package. Reclassifying the pitches as their set types and melting down the Fangraphs data, a data frame of 1422 pitches was created with each model’s 2022 scores and the actual 2023 run value. It’s worth noting this is a smaller sample than the one above due primarily to some differences in classifying pitches between Fangraphs and Baseball Savant. A similar data test to the ones above was then conducted with Arsenal+ and FG’s Stuff Models.

FG’s Stuff+ model competed very closely with the Arsenal+ until roughly the 250 pitch mark, in which Arsenal+ grew in predictive value while the FG’s Stuff+ model plateaued. For the entirety of the sample, the Arsenal+ model seemingly outperformed the Stuff models, although the difference was minimal until the halfway point. As mentioned previously, Arsenal+’s need for the sample size to stabilize oftentimes can hurt the metric early, but ultimately makes it superior in value. On an RMSE basis across the entire 2022-2023 dataset, these were the results:

The results are admittedly not as strong as the r-squared year-over-year values, but Arsenal+ was ahead of all the other metrics until the sample limited to pitcher’s pitches with at least 460 thrown. Having solid testing against one of the most widely-used Stuff metrics in the public space, this piece will move from proving to reasoning behind some of the certain choices and changes within the metric.
Reasoning
The reasoning will cover why given parts were changed from the normal version of a Stuff model, including the addition of variables as well as adjustments. These will be listed individually to provide a clear line of logic.
Added Change Variables
The key differentiator of Pitching+ and Arsenal+, as highlighted previously, is the model's consideration of additional changes to a pitch as well as the given pitch type. The variables selected for change were exactly those of the Pitching+ model. Each element of Pitching+ was subtracted from the prior pitch, giving difference variables that were used in the model.
The reasoning behind electing the same variables is that if a given metric is important to Pitching+, their change, at least to an extent, must be important concerning how the pitches play off one another. To confirm this, feature importance values were run among the models, and each of the different results yielded similar results to the Pitching+ variables, meaning that they were at least semi-important. There were admittedly a few low-ranking variables, although justifying a change in the metric and then negating the metric as a whole seemed to be counterintuitive to what was trying to be solved. For the prior pitch dummy variables, it seemed important that the model could differentiate between past pitch types so that certain changes could be correctly given more emphasis. Without the prior pitch types, there is limited context.
Metric Adjustments
As stated before, the model adjusts for count, pitch type, lefty-righty matchups, as well as whether runners are on base or not. In regards to count and pitch type, most public versions of Stuff+ already consider this, and for good reasoning. Hitters tend to do worse against certain pitches and also struggle more in certain counts. If a given pitcher happens to throw more of these pitches or go into certain counts more often than others, it is more indicative of strategy compared to actual skill. These metrics aim to quantify skill.
The lefty-righty matchup follows a similar logic to the one above, at least in the regard of quantifying skill. The pitcher does not necessarily control whether they’re facing a lefty or righty, although it has been repeatedly proven that they will do better against one versus another (depending on the matchup, of course). If they happen to face one more than the other, their actual level of skill versus their run avoidance will differ, causing the model to improperly estimate the pitch and differential of the last pitch’s metrics ability to limit runs. Hence, an adjustment was necessary to ensure the model’s accuracy.
For the men on base situation, the main difference comes in the form of having to go to the stretch or the windup. While studies have suggested that the stretch does not show a significant difference from the windup in terms of generating velocity, the numbers suggest that hitters have consistently been able to do better. Over the past decade, hitters have had a higher wOBA in each season with men on base than with men off. While this could be more psychological instead of being the stretch/windup argument, it is clear that pitcher performance is significantly difference with men on base. Therefore, if a pitcher is stuck with a bad defense and subject to a higher rate of men on base in general, then the pitcher will likely perform worse against all other batters to no fault of his own. It seems unfair to penalize at that point for something that is not necessarily the pitcher’s fault, warranting adjustment.
Potential Shortfalls
Like any pitch model, it is far from perfect - the goal is just to get closer to that point. Arsenal+, while an improvement from the other metrics, still has inherent biases and shortfalls. In identifying these, there is hope to provide improvement and upgrades so that the model can ultimately be better.
Sequencing Bias
In acknowledging the sequencing bias, it is important to remember that the goal of this model is to articulate how well two given pitches within a plate appearance play off one another. In that, it is considering the two dummy variables of the given pitch types, which could lead to some form of bias during the training for given combinations of pitches. To that extent, sequencing is much less skill than strategy, which is not necessarily the goal of Arsenal+. It is necessary to acknowledge that knowledge of both pitch types is needed to emphasize given changes, which makes this bias outweighed by the need to consider the factor. Hence, it’s continued inclusion. If one were to quantify such a players’ (or teams’) strategy, they’d almost need an entirely new metric (this will be further investigated).
Limited Adjustments
While the adjustments provided were more advanced than what is currently being done with Stuff-like models, there is still much room for improvement in a V2. Park Factor could be a crucial adjustment, as runs are just scored more in a ballpark regardless of who is on the mound for a given day. A defensive adjustment could also be made, adjusting the given run values based on a defense’s ability to play so that the model trains more precisely to a pitcher’s true talent level. Isolating for certain factors that are not in the pitcher’s control is crucial in getting to the actual talent level because getting to that level is often more predictive given the external circumstances are not permanent.
Decreased Stabilization in Predictive Ability
As was pointed out in the chart, when considering more samples with minimum pitch-thrown requirements, Arsenal+ underperformed some of the other metrics in its predictive ability. It is not ideal in any way for a model with increased consideration to underperform that of a lesser consideration, although the inclusion of small sample size pitches made that possible. Discovering a way for the model to be more predictive at a faster pace is one of my top priorities in its development. I believe it is highly likely to be discovered, as classifying the relationship between current and past pitches is only starting to be thoroughly learned in the sense of Machine Learning.
Conclusion
It’s all about improvement. While Stuff+, Location+, and Pitching+ are all extremely valuable in considering the value of a pitcher, there was room for enhanced consideration - integrating the change from past pitches, It has always been known that considering how pitches play off one another is important - that is fairly standard in evaluating a pitcher’s mix. Yet, a lack of its inclusion into some of the most highly used pitch-metric models seemed to be giving people only a part of the story. With the evidence provided, the metric was able to reject the null hypothesis of assuming the current models are the best way to approach the issue and prove value beyond what is currently available. While I do not believe this metric to be an end-all-be-all pitching evaluator in any sort of capacity, I do believe that it can more properly assist in gauging the skill level of a given pitch, even if the available version is only V1. In the future, expect to see improvements to this new pitch-level metric.